Can GIS help identify where Britain's future vineyards could grow?
A multi-criteria spatial model that turns climate, terrain and land-use evidence into a transparent regional suitability surface — then checks how that surface behaves against 1,095 existing vineyard locations.
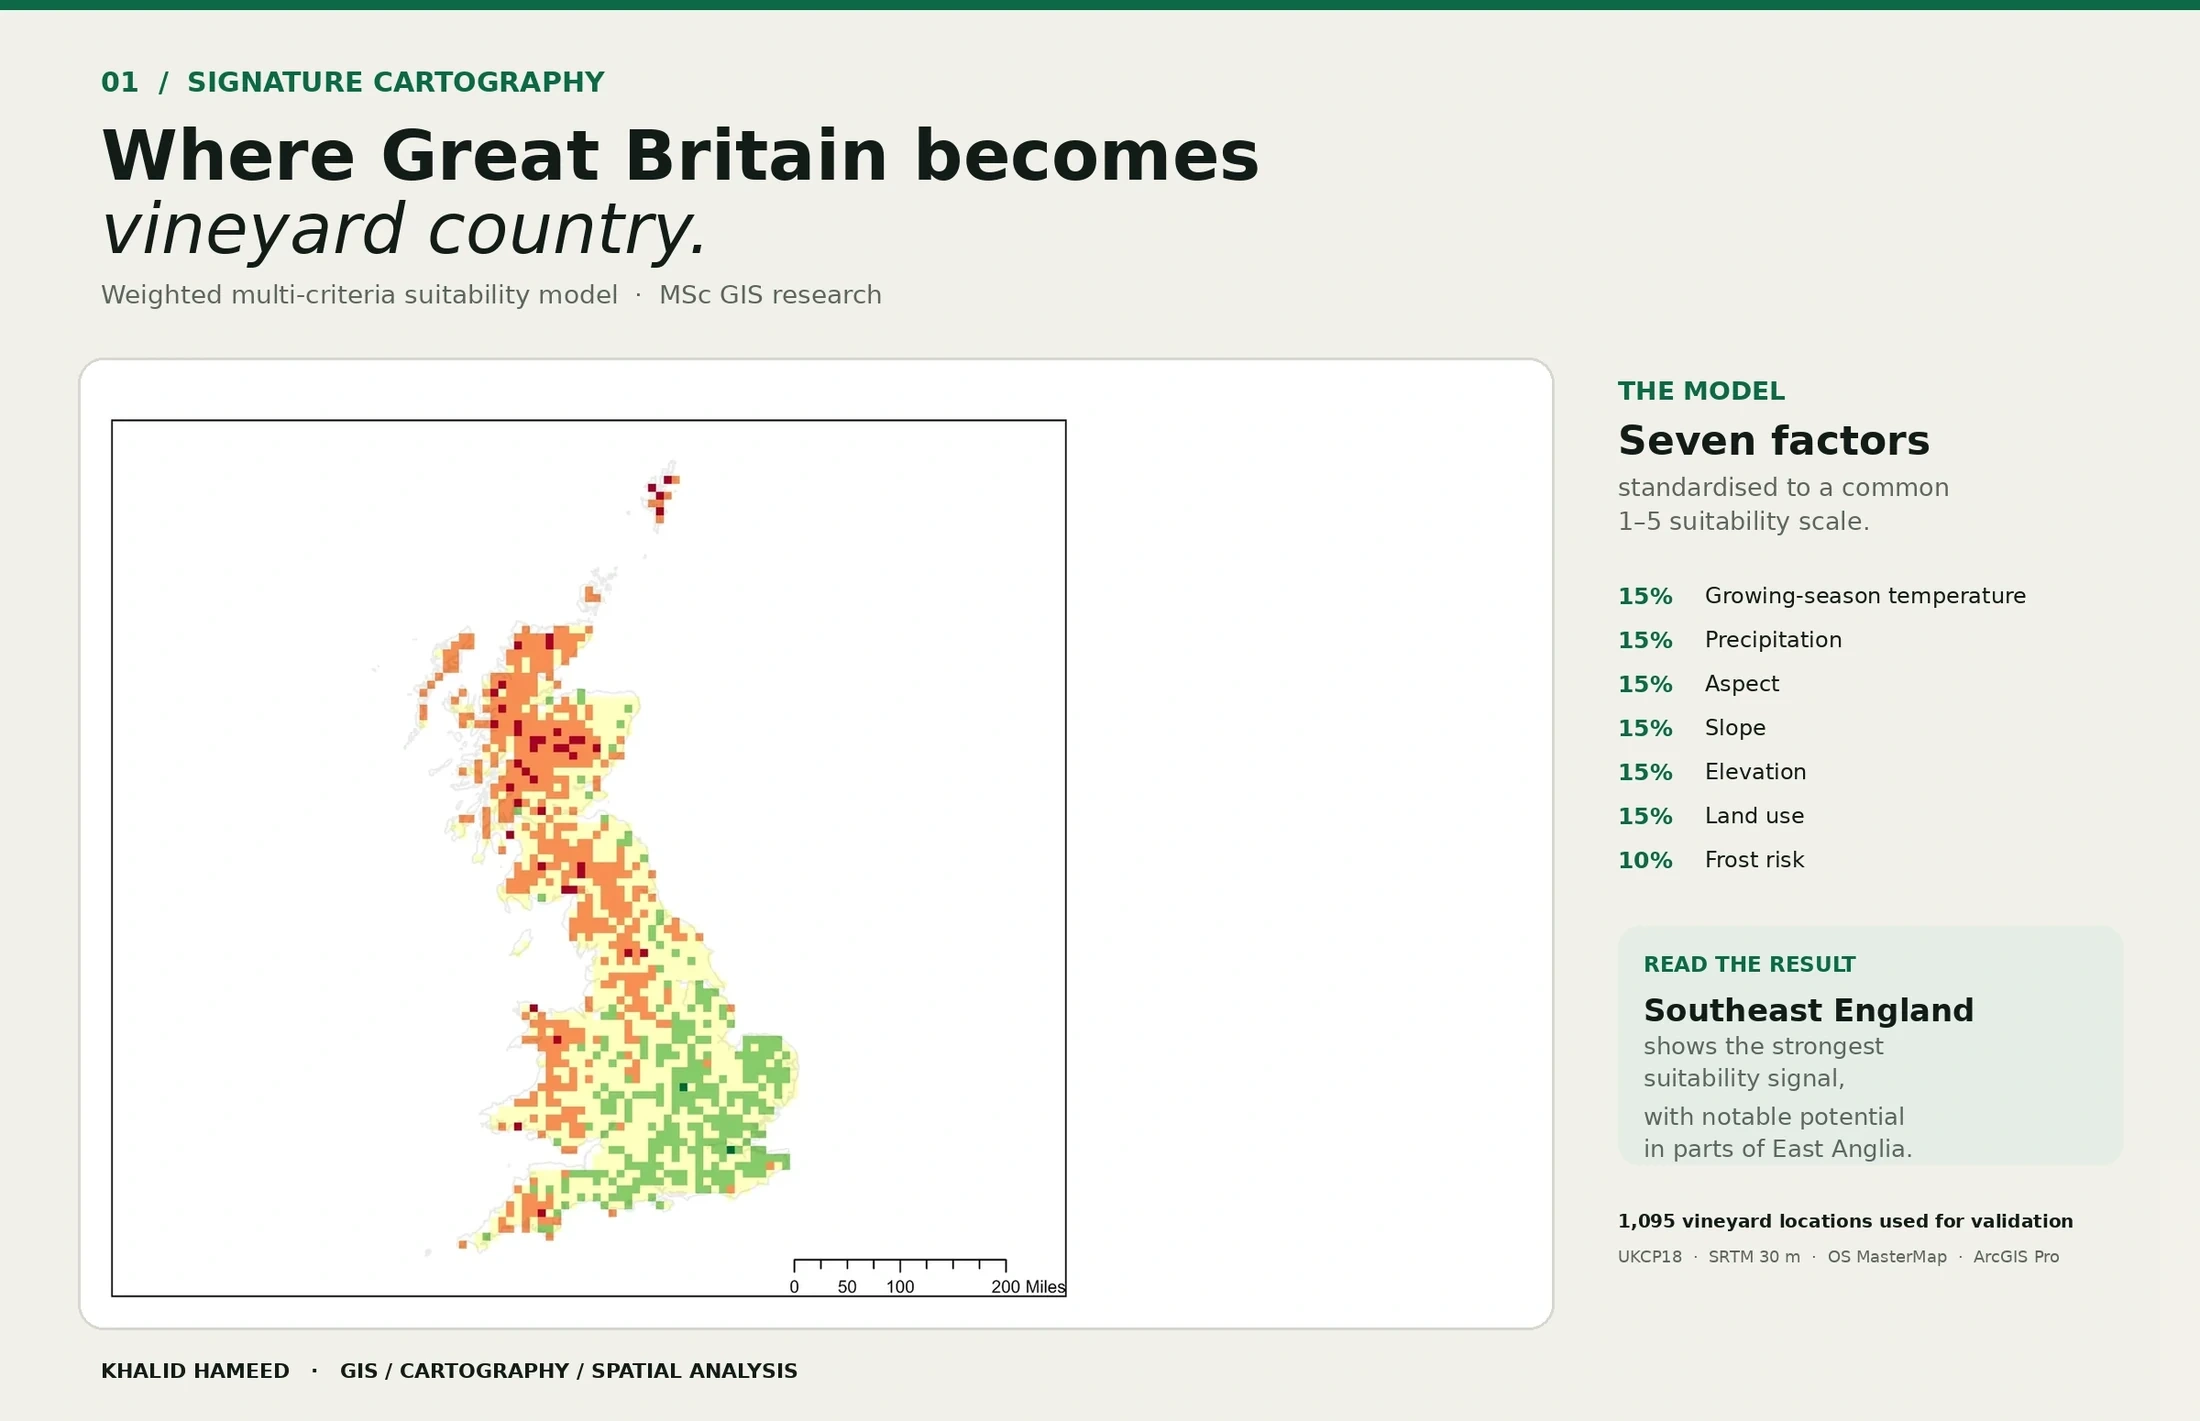
The decision surface
Different evidence.
One spatial question.
The project asks where environmental conditions combine most favourably for vineyard development — and whether those patterns broadly correspond with where vineyards already exist.
Seven inputs.
One common scale.
The original analysis standardised seven environmental criteria by reclassifying them into five suitability classes before combining them with weighted overlay.
From raw layers
to decision support.
The value of the model is not the final colour ramp alone. It is the transparent chain of spatial operations that produces it.
Read the model
layer by layer.
The final surface is easier to interpret when the component evidence remains visible. These plates keep the cartographic argument connected to the underlying GIS workflow.
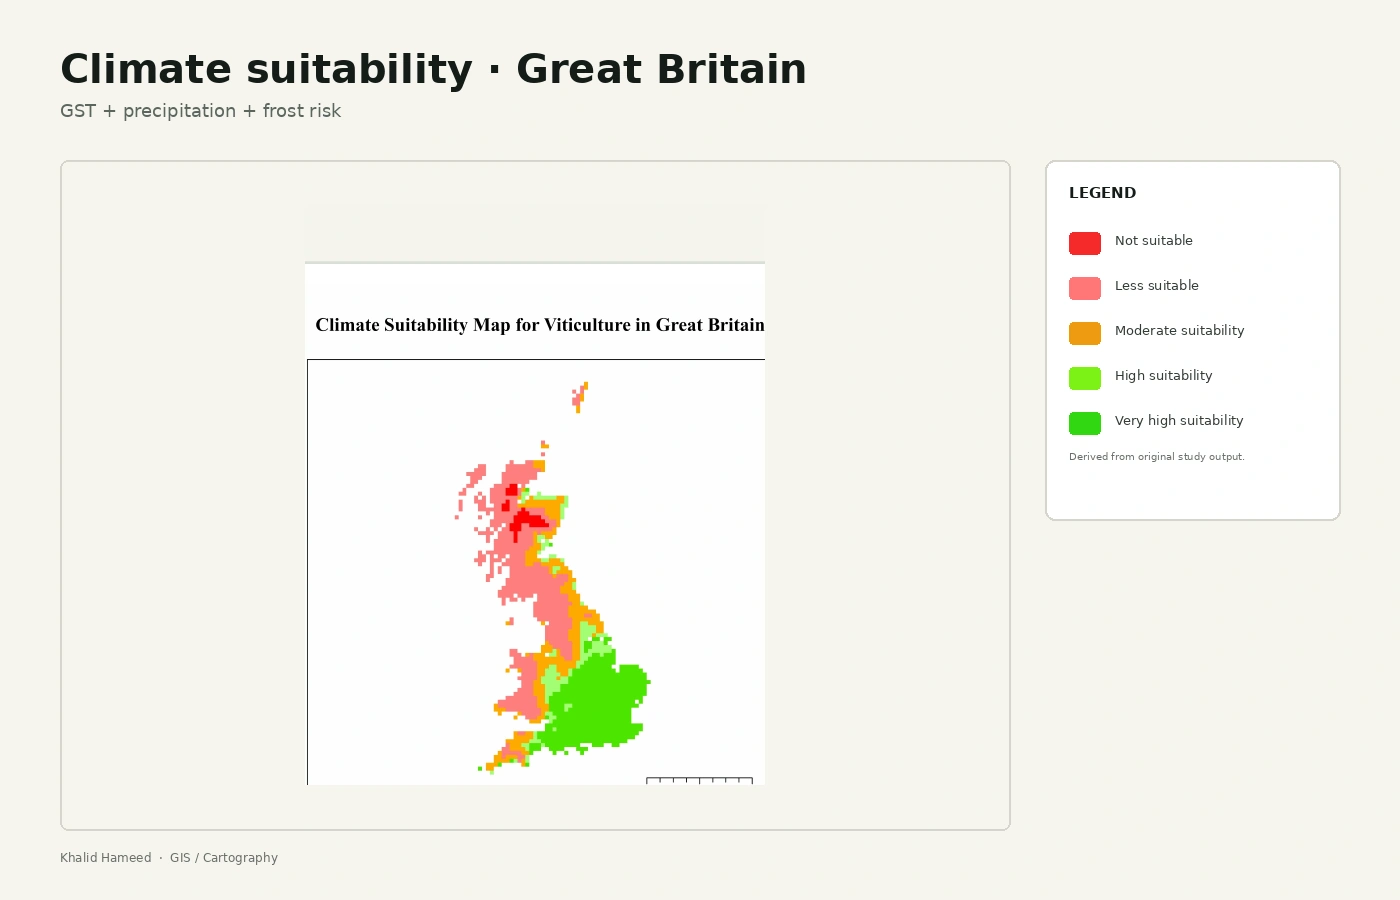
Temperature, precipitation and frost risk form the climatic side of the suitability signal.
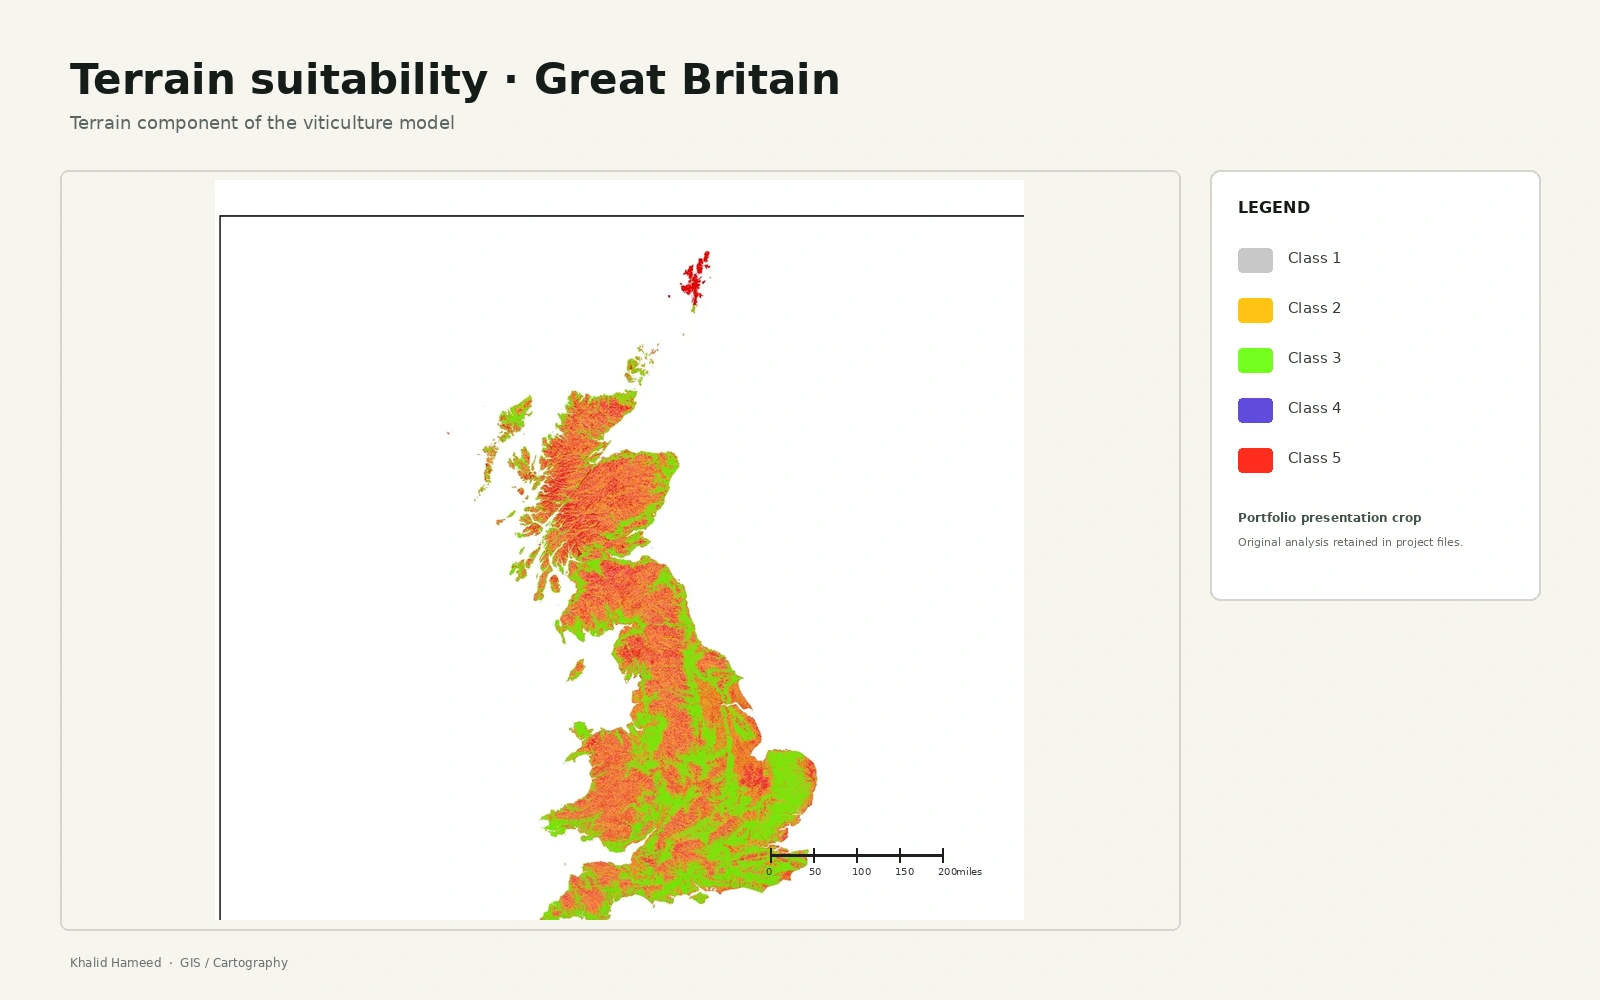
Topography changes exposure, drainage, temperature and practical vineyard constraints.
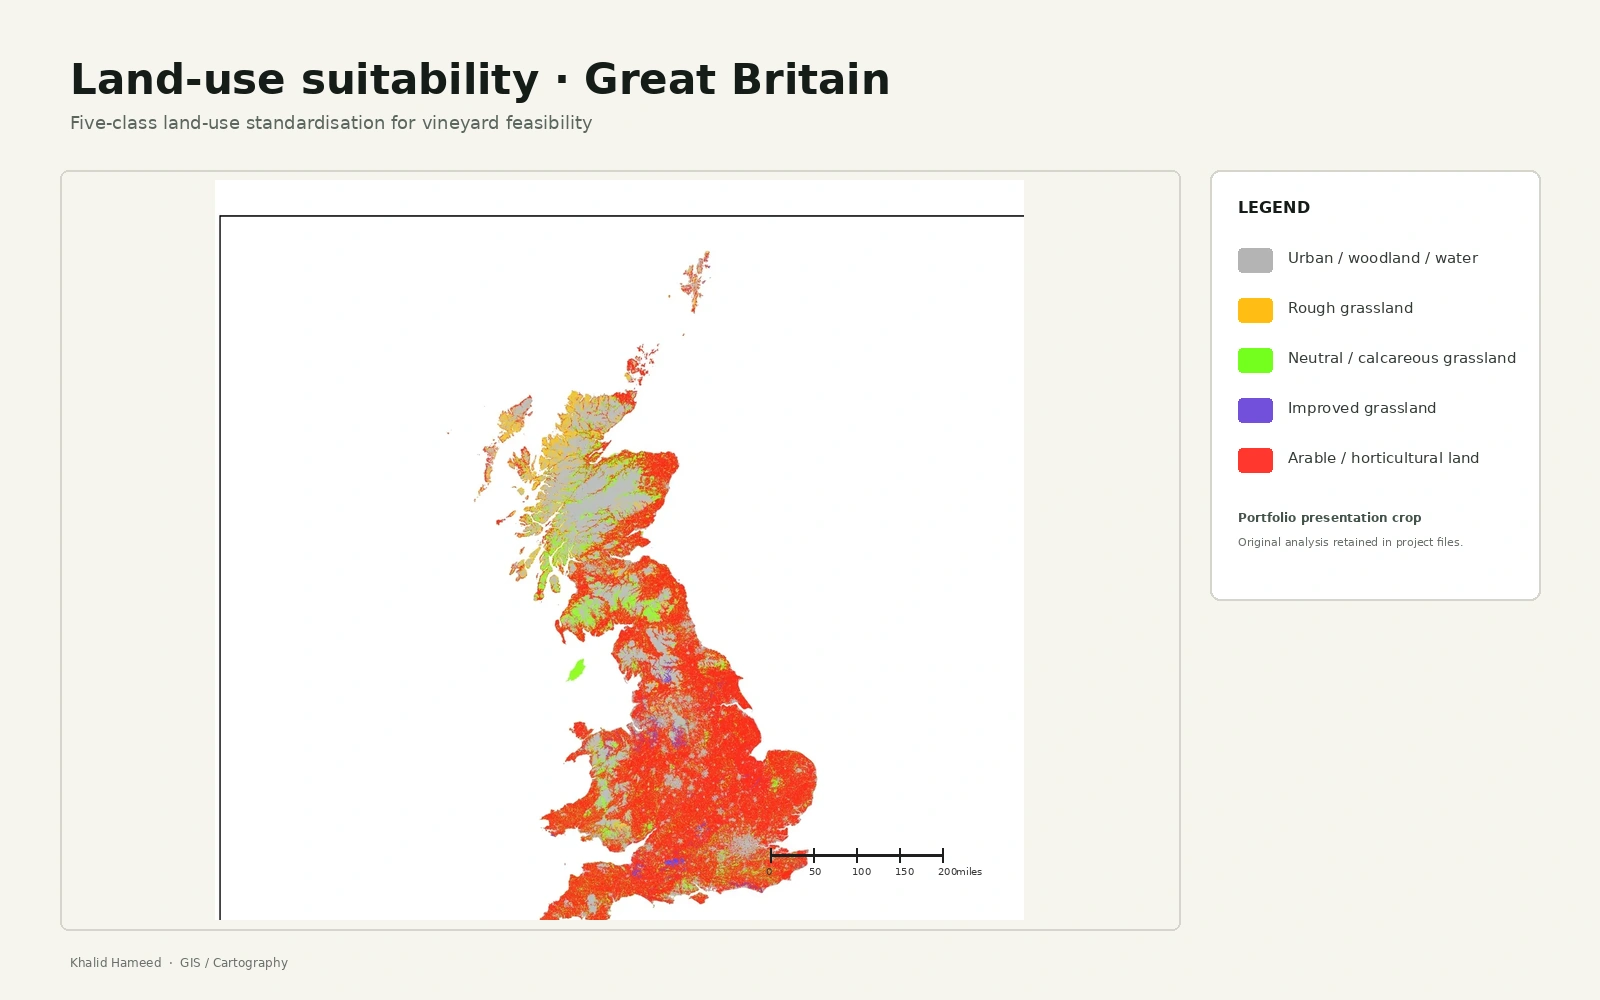
Environmental suitability still needs an appropriate land-use context.
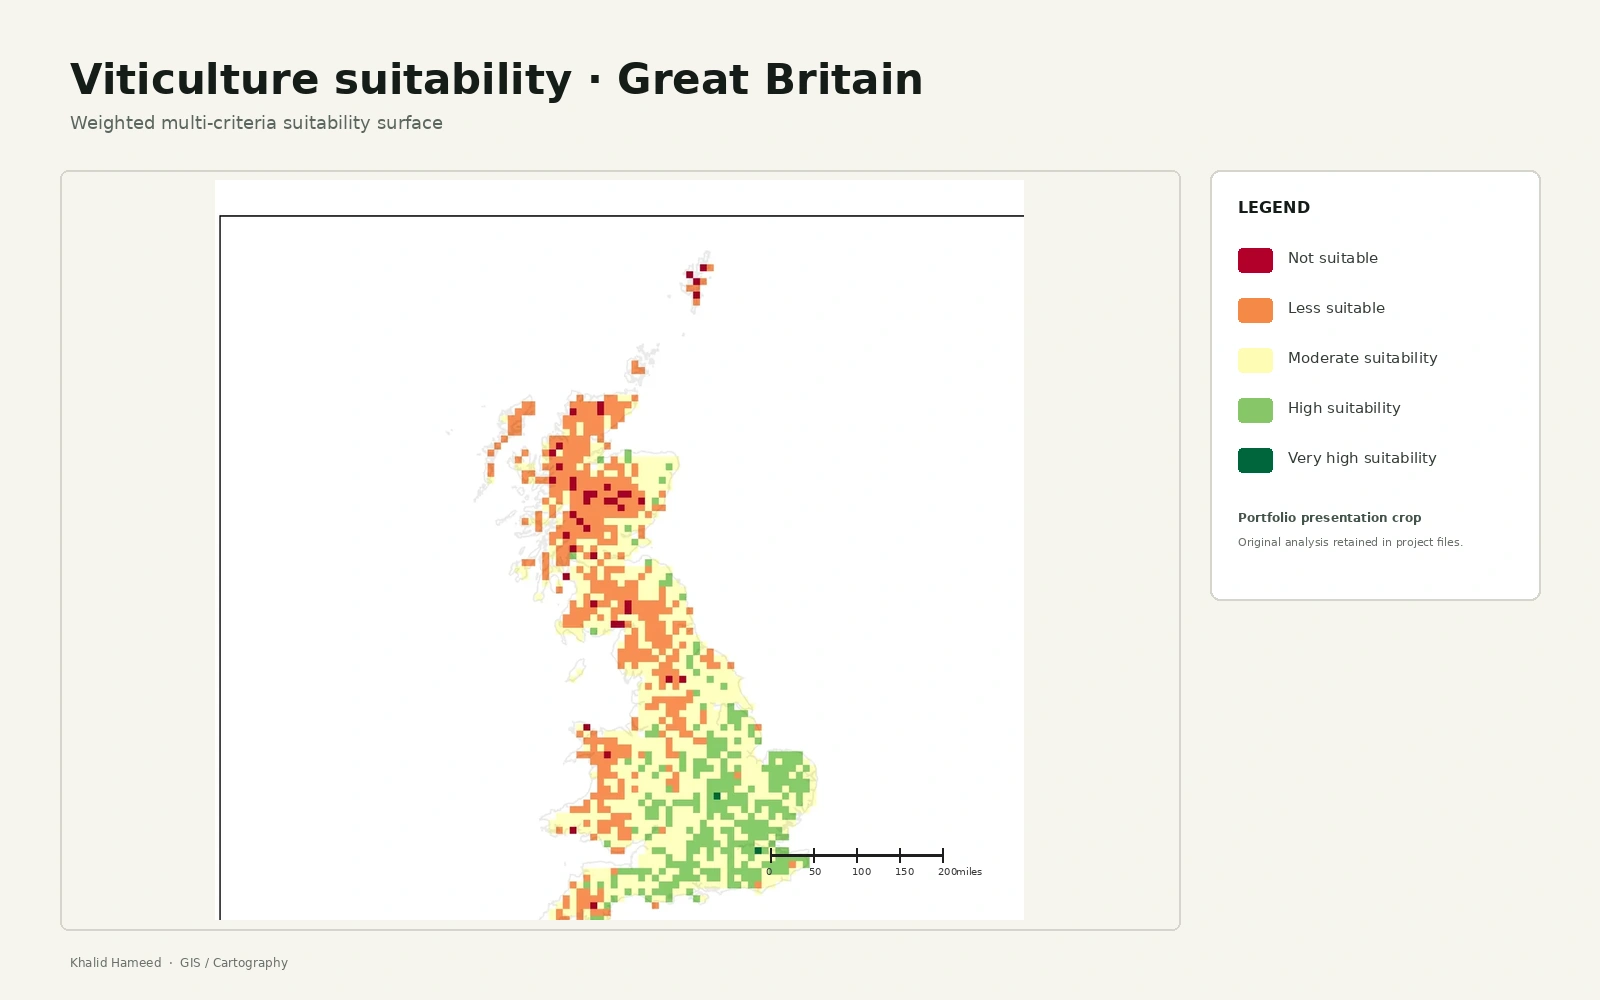
A strong southeast–northwest pattern emerges, with higher classes concentrated in southeast England and parts of East Anglia.
Does the model resemble the landscape we already know?
Suitability scores were extracted at existing vineyard locations and compared across vineyard size categories. Larger operations showed a more concentrated distribution around higher suitability scores, while smaller vineyards occupied a wider range of values.
A screening model,
not a planting prescription.
The project is strongest when its limits are made visible. The model identifies regional spatial patterns; it does not replace field investigation or commercial feasibility assessment.
The climate evidence operates at a coarser scale than field-level decisions.
The study uses a single RCP8.5 scenario rather than a multi-scenario ensemble.
Soil chemistry and microbiology are not represented in the current model.
Market access, labour, land cost and infrastructure are outside the suitability surface.
Portfolio takeaway
Good GIS doesn't stop at the map.
This project demonstrates a complete spatial reasoning loop: integrate heterogeneous datasets, formalise assumptions, model suitability, validate against observed locations, communicate uncertainty and identify the next data that would make the decision stronger.